
Data-Driven Purchasing Guide for Shoe Stores

Discover how to make more profitable and accurate wholesale purchasing decisions for your shoe store by using past sales data instead of relying on personal taste. Learn which reports to track and how to turn that data into a strategy.
When creating a new season collection for your shoe store, how do you decide which models to invest in? Many retailers make this critical decision based on their personal preferences or current fashion trends, that is, instinctively. While this approach sometimes works, it often leads to unsold stock on shelves and missed sales opportunities. The foundation of a successful purchasing strategy relies on concrete data produced by your own store rather than predictions. Understanding what your customers buy, when, and at what price directly determines the profitability of your next wholesale order.
Basics of Data-Driven Purchasing: Where to Start?
Data-driven purchasing is, in its simplest definition, the process of forecasting and planning future inventory needs by using past performance metrics. This approach allows the store owner to move beyond personal tastes and focus directly on customer demand. By directing your capital toward products with the highest return potential, you minimize risk and increase profit margins.
Going Beyond Intuitive Choices
As a store owner, you may have a personal preference for a certain style or color. However, a stiletto model that you favor may not be the right product for your store’s customer base. Intuition can provide a general sense of the market, but it cannot tell you which size sells faster, which color moved more within a given month, or which price range is the most attractive to your customers. Data provides clear and objective answers to these questions. This means moving away from emotional decisions and grounding your business in mathematical analysis.
Necessary Data Sources and Tools
You don’t need complex or expensive software to start data collection. If you use a modern point-of-sale (POS) system, you likely already have access to the basic reporting features you need. If you run an e-commerce site, the platform’s analytics tools provide valuable customer and sales data. If you don’t yet have these systems, a simple spreadsheet (like Excel or Google Sheets) can suffice. The critical part is consistently recording the following information for every sold item: product code (SKU), category, brand, color, size, sale date, and sale price.
Key Sales Reports to Analyze
The data you collect becomes a treasure when properly analyzed. Sales reports reveal not just which products have sold, but also provide an overall picture of your business health. These reports should form the foundation of your next wholesale purchase list. Reviewing these reports regularly, for example weekly or monthly, helps you spot trends early.
Bestselling Products Report
As the name suggests, this report lists your top-selling products over a specific period. However, analysis should not stop there. Examine which color and size combinations of a bestselling women’s sports shoe model are selling the fastest. Perhaps white sizes 37 and 38 sell out as soon as they arrive in stock, while black size 40 moves more slowly. This detail directly guides how you distribute your size run in your next order. Additionally, by identifying shared characteristics of these products (such as material type, heel height, price point), you can spot future similar successful models.
Slow-Moving Product Analysis
Analyzing the slowest-selling products is as important as studying the bestsellers. Slow or non-selling items are dead capital that reduces your profitability and occupy valuable shelf space. After identifying these products, ask yourself: Was the price too high? Was the style not appealing to my customer segment? Did it arrive out of season? Or perhaps the product quality did not meet expectations. Lessons from this analysis prevent future repeated mistakes and help refine your purchasing criteria.
Shoe-Specific Metrics That Directly Affect Profitability
Along with general sales reports, some metrics specific to shoe retailing play a critical role in understanding profitability and operational efficiency. Especially size distribution and stock turnover rate are two key factors that can determine a shoe store’s success or failure. Understanding these metrics helps you use your wholesale budget most efficiently.
Assortment and Size Distribution Analysis
Standard wholesale shoe assortments typically include sizes from 36 to 40 or from 40 to 44. However, your store’s customer profile may not fit this standard distribution. Analyze your past sales data to identify the most demanded sizes. For example, if you frequently run out of stock in sizes 37 and 38, rather than ordering a standard assortment, consider working with your supplier or using flexible order platforms like Bulkoon to create a custom assortment weighted toward these sizes. Correct size distribution increases sales and reduces the cost of leftover single sizes at the season’s end.
Seasonal Performance and Stock Turnover Rate
Stock turnover rate is a measure of how quickly your inventory is sold and converted into cash. This metric is especially vital for seasonal products like summer slippers or winter boots. Having a large amount of leftover seasonal stock at the end of a season forces you to apply heavy discounts and erodes your profit margin. Examine last year’s sales data for the same period to identify which products sold quickly at the beginning of the season and which lagged behind. This insight guides you on how much stock to buy for the upcoming season and when to display products in-store.
Turning Data Into Wholesale Order Strategy
Collecting and analyzing data is only half of the equation. The real value emerges when you turn these analytical insights into concrete purchasing decisions. Your analysis should offer a roadmap indicating which products to reorder, which suppliers to continue working with, and which new trends to invest in.
Measuring Supplier and Brand Performance
Compare the performance of products from different suppliers or brands. Which brand’s products have higher sales velocity and profit margin? Which supplier’s products generate fewer returns? These data points show which partnerships are more valuable for you. You can deepen relationships with high-performing suppliers and review underperformers. Platforms like Bulkoon let you examine products from over 100 approved suppliers in one place, making these comparisons more efficient.
Testing New Trends With Data
Trying out a new trend always involves risk, but this risk can be managed. Analyze the features of your historically successful products (such as a particular sole type, color palette, or material). Does the new trend share any of these successful features? If so, rather than placing a large order, test the trend with a small quantity. Monitor the sales performance of these test products closely. If they sell quickly, you can reorder fast before your stock runs out. This strategy helps you keep up with fashion while protecting your capital.
Using Data on Digital Wholesale Platforms
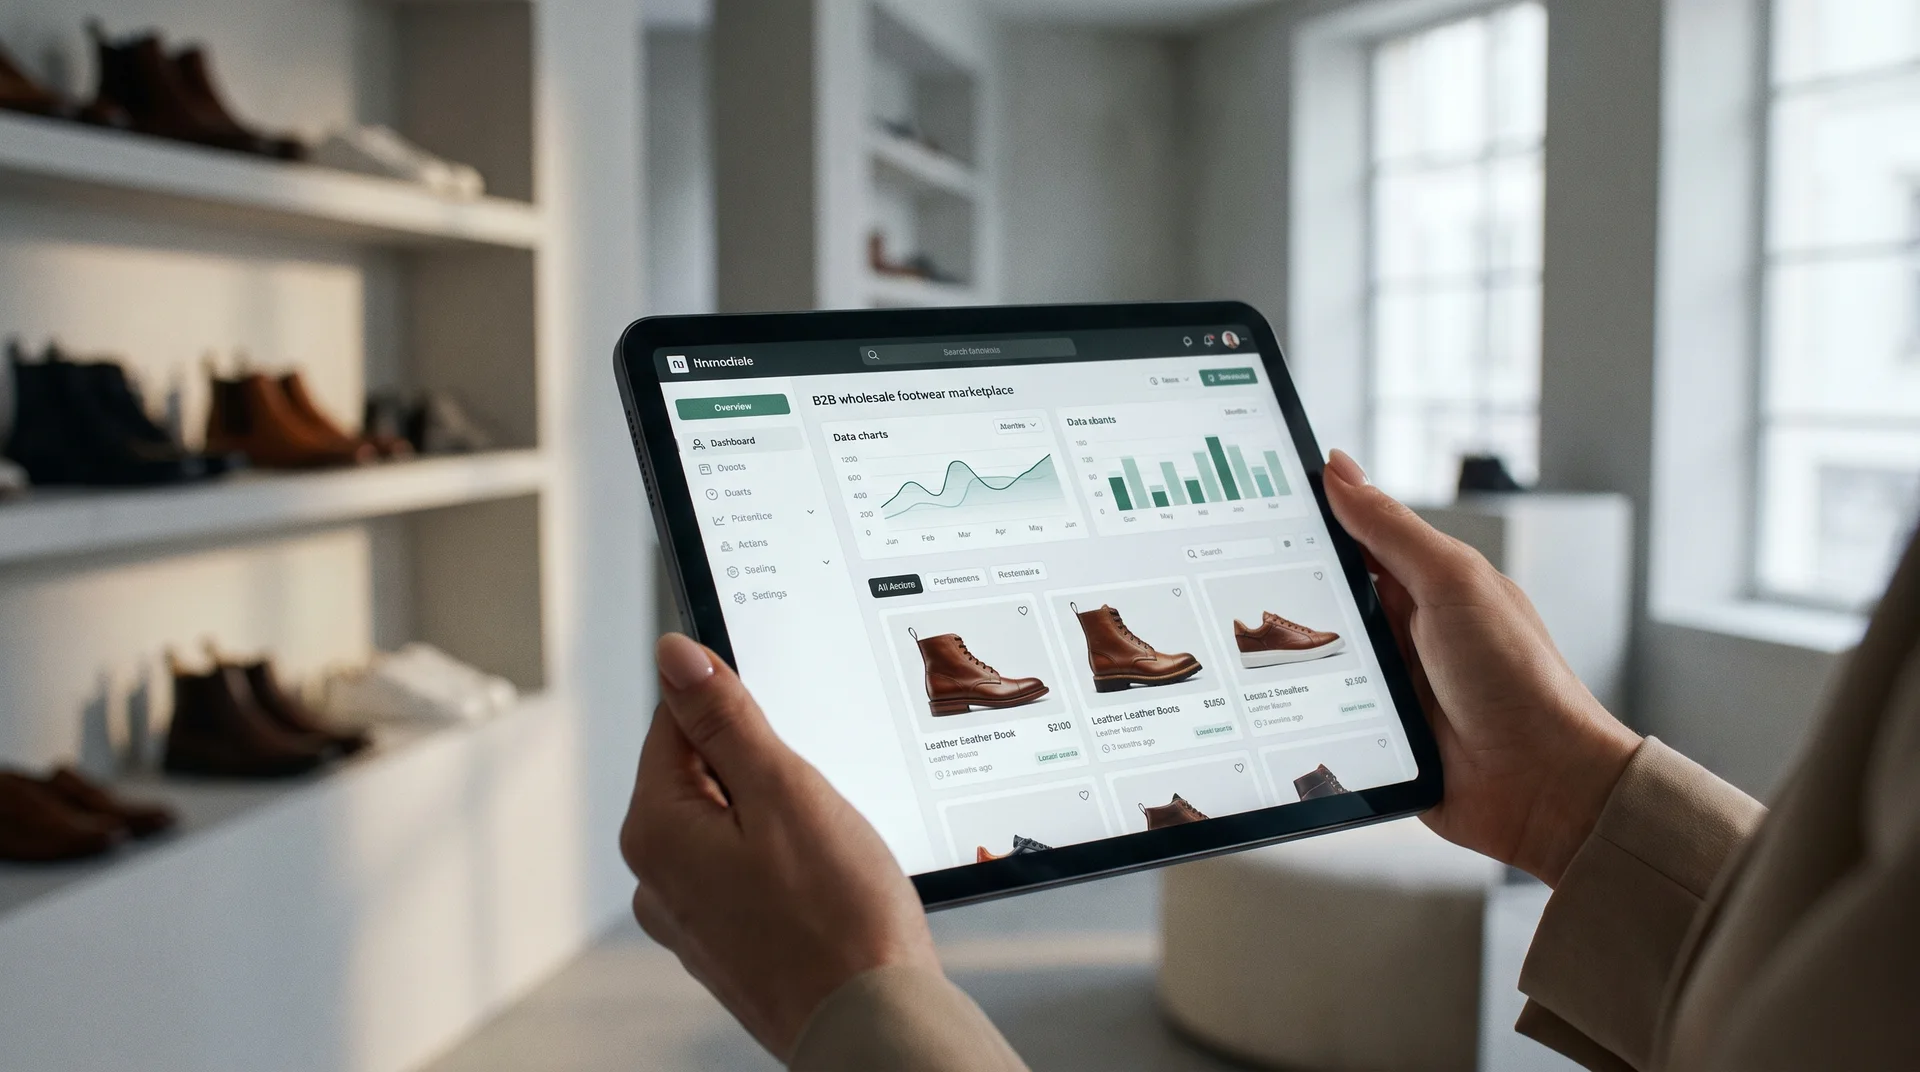
Digital B2B platforms provide powerful tools to apply data-driven purchasing strategies. These platforms not only grant access to a wide product range but also allow you to find specific products in seconds. Combining your own sales data with the capabilities of these platforms significantly optimizes your purchasing process.
Efficient Product Discovery With Smart Filtering
Let’s say your sales analysis shows that your bestselling products are beige, low-heeled, patent leather heeled shoes. Using this knowledge, you can enter a platform like Bulkoon and filter by these three criteria (color: beige, heel type: low, material: patent leather). This enables you to target products with the highest success potential from thousands of models directly. Bulkoon’s AI-powered smart selection and detailed filtering features make this process even easier and save you time.
Ready Stock and Fast Supply Advantage
Data analysis helps forecast when the stock of a popular product will reach a critical low level. At that point, fast supply becomes crucial. Platforms like Bulkoon that offer only ready stock, rather than made-to-order suppliers, provide a big advantage. When the stock of a popular men’s sports shoe model runs low, you can immediately place a new order via the platform and eliminate the risk of lost sales. This agility directly enhances customer satisfaction and your revenue.
Conclusion: Building a Data-Focused Purchasing Culture
Success in shoe retail is no longer just about having good taste. To stand out in the competition and sustain profitability, using data as a guide has become mandatory. Regularly analyzing your sales data, applying the insights you gain to wholesale purchasing decisions, and utilizing digital tools effectively help you build your store on stronger foundations. This is not a one-time task but a continuous learning and optimization process. By adopting a data-driven approach, you can start every new season better prepared, more strategic, and more profitable.